TVL Health Calculator
Calculate a risk-adjusted TVL score by accounting for key factors that impact the reliability of Total Value Locked numbers in DeFi protocols.
Imagine a DeFi dashboard flashing a record‑high $150 billion in Total Value Locked (TVL) and investors rushing in, only to discover the number was a mirage. TVL manipulation isn’t a rare glitch; it’s a growing playbook that lets projects look far bigger than they really are.
What TVL Actually Measures
Total Value Locked (TVL) is the aggregate USD value of all crypto assets that a DeFi protocol has locked in its smart contracts, whether through liquidity provision, staking, or collateral. In simple terms, it’s the total amount of money users have entrusted to a platform at any given moment.
Data aggregators like DeFiLlama, DappRadar and l2Beat pull these figures straight from on‑chain contracts, convert token amounts to dollar values using current market prices, and then sum everything up.
Why TVL Became the DeFi Scorecard
High TVL is often taken as a badge of confidence. It signals liquidity, user trust, and a platform’s ability to attract capital. Investors use it to size up market share, developers glance at it to gauge network effects, and marketers brag about it to raise community hype.
But TVL tells you almost nothing about:
- Revenue or profitability
- Actual user activity (trades, withdrawals, fees)
- Underlying risk (smart‑contract bugs, liquidation exposure)
Common Ways TVL Gets Inflated
Because TVL is derived from on‑chain data and market prices, a handful of tactics can pad the number without delivering real value.
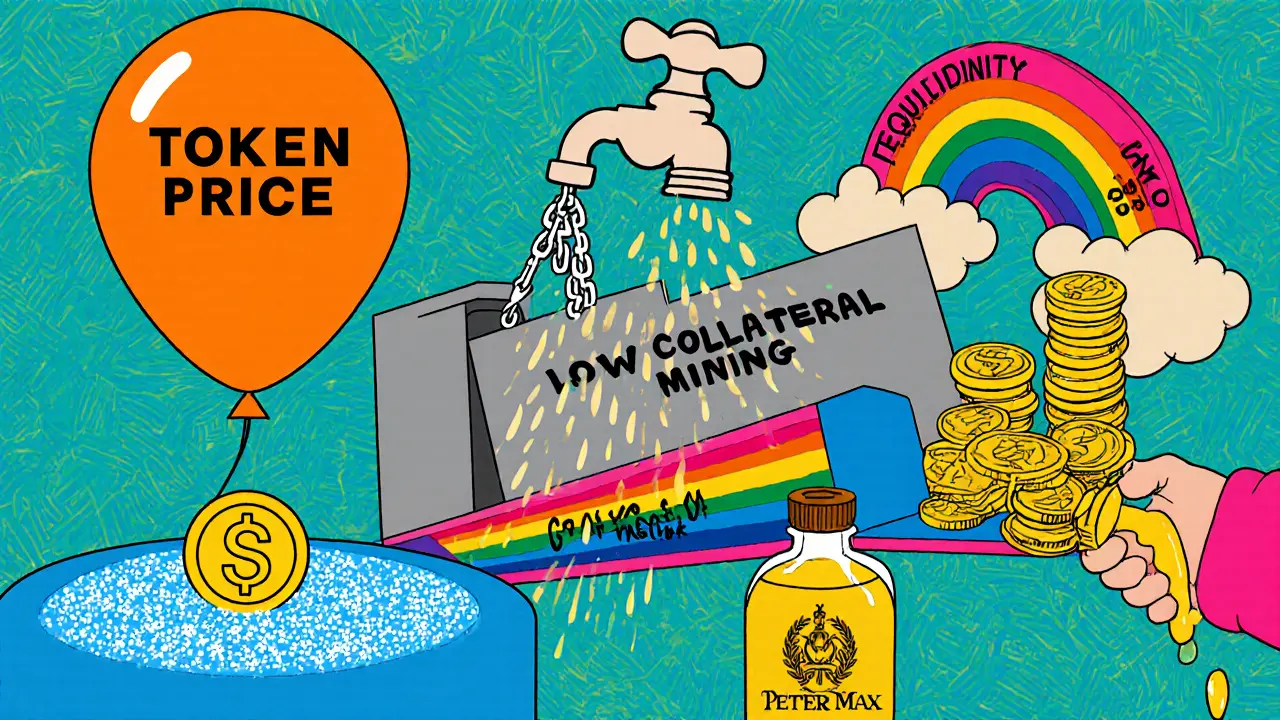
- Price Pumping of Underlying Tokens: If a protocol’s native token spikes, the USD‑valued TVL surges instantly, even if the amount of token locked stays flat.
- Liquidity Mining Rewards: Projects distribute large amounts of newly minted tokens to liquidity providers. When providers lock assets just to harvest rewards, TVL spikes temporarily.
- Artificial Collateral Ratios: By lowering the required collateral ratio for borrowers, a protocol can lock more assets on paper while the economic exposure remains modest.
- Cross‑Chain Bridge Swaps: Some platforms count assets that are merely bridged, not actually secured on the primary chain, inflating the apparent lock‑up.
- Self‑Deposit Incentives: Teams reward users for depositing their own holdings, essentially moving money from the project’s treasury back into the protocol.

Real‑World Red Flags to Watch
While documented cases are often shrouded in anonymity, the patterns show up repeatedly:
- Sudden TVL jumps coinciding with a token airdrop announcement.
- Liquidity pools that offer absurdly high APRs (e.g., 5,000% APY) and disappear within weeks.
- TVL spikes on days when the broader market is stagnant, hinting at internal token price manipulation.
- Projects that list a “TVL” that includes assets on Layer 2 testnets or sidechains not yet secured.
Detecting Manipulation: Tools and Techniques
Smart investors combine on‑chain analysis with off‑chain signals. Below is a quick comparison of manipulation tactics versus detection cues.
| Tactic | What to Look For | Effective Countermeasure |
|---|---|---|
| Token price pumping | Sharp price rise unrelated to market news | Cross‑check TVL with volume‑adjusted price indices |
| Liquidity mining rewards | Massive, short‑lived TVL spikes after reward announcements | Filter TVL by “stable‑lock” duration (e.g., >30 days) |
| Artificial collateral ratios | Low collateral‑to‑debt ratios posted in protocol docs | Calculate risk‑adjusted TVL using actual collateral value |
| Bridge‑based locking | TVL includes assets on non‑mainnet bridges | Use aggregators that separate “native” vs “bridged” TVL |
| Self‑deposit incentives | Treasury‑to‑protocol fund flows shortly before TVL reports | Audit treasury movements on‑chain; exclude internal transfers |
Beyond TVL: Safer Metrics for Evaluating DeFi Projects
Relying solely on TVL is like judging a restaurant by its decor. Consider these complementary numbers:
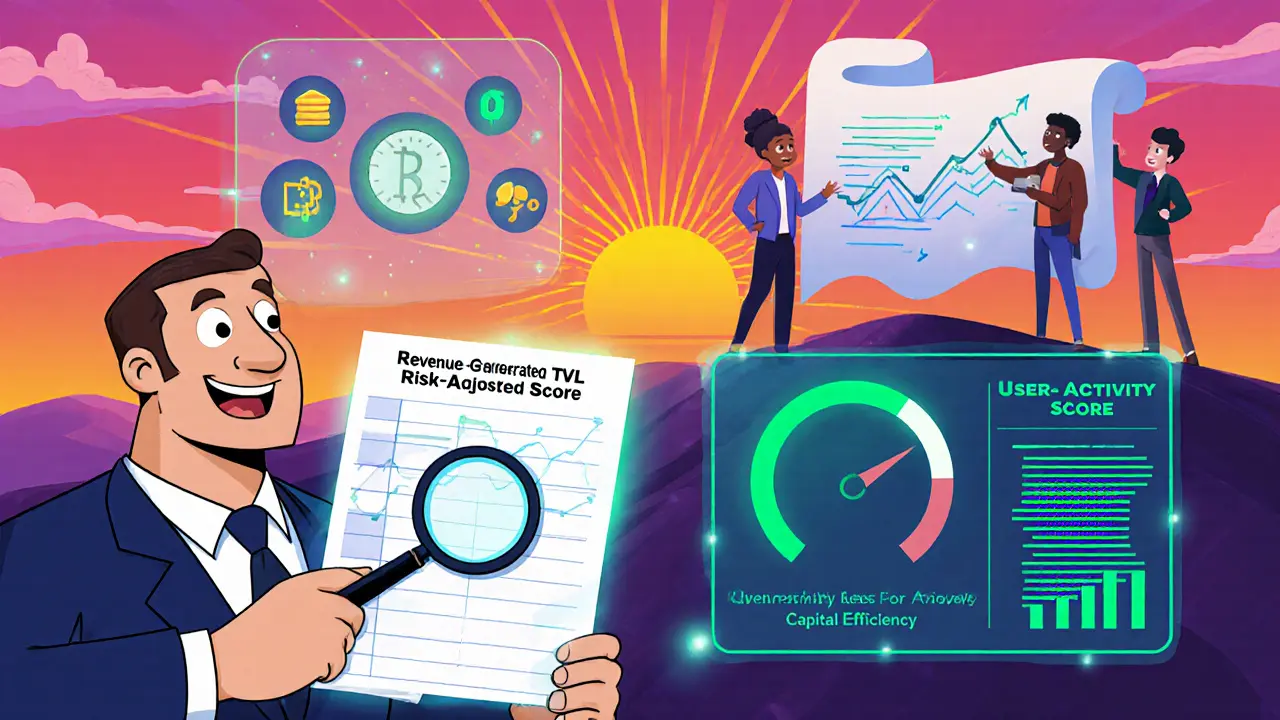
- Revenue‑Generated TVL (rTVL): TVL weighted by fee earnings, showing how much value actually produces income.
- Risk‑Adjusted TVL (raTVL): TVL multiplied by a safety factor derived from audit scores and collateral health.
- User Activity Score: Daily active addresses, transaction count, and average trade size.
- Capital Efficiency: Fees earned per dollar locked, indicating how productively the protocol uses its capital.

Checklist: Spotting Inflated TVL
Before you trust a headline‑grabbing TVL number, run through this short list:
- Is the TVL surge tied to a new token reward or airdrop?
- Do the underlying token prices show abnormal movement?
- How long have the locked assets stayed in the contract? (Prefer >30 days.)
- Does the protocol disclose how much TVL comes from bridges or testnets?
- What do independent analytics platforms (DeFiLlama, DappRadar) report versus the project’s own dashboard?
What Developers Can Do to Build Trust
Transparency wins in the long run. Here’s what protocol teams can publish:
- Breakdown of TVL by token, chain, and lock‑duration.
- Audit reports that include TVL calculation methodology.
- Open‑source scripts that let anyone verify TVL numbers.
- Regular “TVL health” reports that discuss price volatility impact.
When teams share these details, investors can focus on genuine growth rather than marketing hype.
Future Outlook: Standardizing TVL Across the Ecosystem
Industry groups are already drafting unified TVL definitions that factor in price‑oracle reliability, bridge security, and lock‑time thresholds. If the community adopts a common standard, the window for quick‑fix TVL inflation will shrink dramatically.
Until then, stay curious, dig deeper than the headline, and remember that a big number only matters if the underlying fundamentals back it up.
What does TVL actually measure?
TVL adds up the USD value of every token locked in a DeFi protocol’s smart contracts, whether through staking, liquidity pools, or collateral.
Why can TVL be misleading?
TVL ignores revenue, user activity, and risk. A protocol can show a huge TVL while earning little or holding unsafe collateral.
How do projects artificially boost TVL?
Common tricks include token price pumping, short‑term liquidity‑mining rewards, low collateral ratios, counting bridged assets, and moving treasury funds back into the protocol.
What metrics should I look at besides TVL?
Consider revenue‑generated TVL, risk‑adjusted TVL, user activity scores, and capital efficiency (fees per dollar locked).
How can I verify a protocol’s TVL claim?
Cross‑check the number on independent aggregators like DeFiLlama, inspect the on‑chain contracts yourself, and review the lock‑duration breakdown that reputable projects publish.

Write a comment